

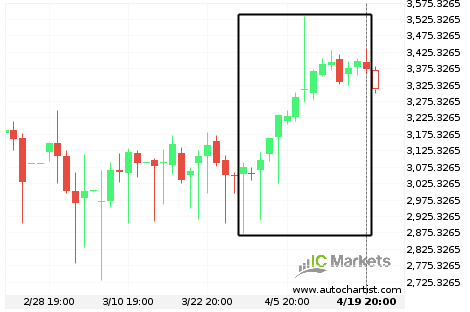
Huge bullish move on US SPX 500 Index
US SPX 500 Index has moved higher by 6.33% from 3,894.9 to 4,165.1 in the last 27 days.
What’s going on with Amazon.Com Inc.?
Those of you that are trend followers are probably eagerly watching Amazon.Com Inc. to see if its latest 9.71% move continues. If not, the mean-reversion people out there will be delighted to cash in on this exceptionally large 23 days move.
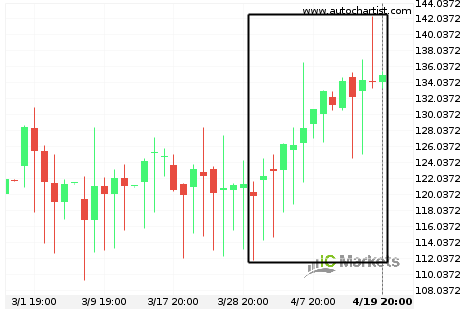
What’s going on with Apple Inc.?
Those of you that are trend followers are probably eagerly watching Apple Inc. to see if its latest 12.55% move continues. If not, the mean-reversion people out there will be delighted to cash in on this exceptionally large 22 days move.
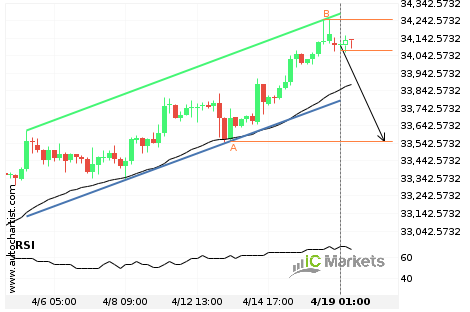
Either a rebound or a breakout imminent on US Wall Street 30 Index
US Wall Street 30 Index is heading towards the support line of a Channel Up. If this movement continues, we expect the price of US Wall Street 30 Index to test 33554.5000 within the next 3 days. But don’t be so quick to trade, it has tested this line numerous times in the past, so […]

Where is Apple Inc. moving to?
A movement of 12.05% over 18 days on Apple Inc. doesn’t go unnoticed. You may start considering where it’s heading next, a continuation of the current upward trend, or a reversal in the previous direction.

Will US Tech 100 Index have enough momentum to break resistance?
US Tech 100 Index is heading towards the resistance line of a Channel Up and could reach this point within the next 3 days. It has tested this line numerous times in the past, and this time could be no different from the past, ending in a rebound instead of a breakout. If the breakout […]

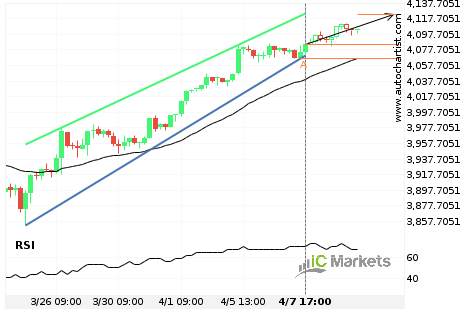
Either a rebound or a breakout imminent on US Tech 100 Index
US Tech 100 Index is heading towards the resistance line of a Channel Up. If this movement continues, we expect the price of US Tech 100 Index to test 14194.1000 within the next 19 hours. But don’t be so quick to trade, it has tested this line numerous times in the past, so this movement […]

Either a rebound or a breakout imminent on US Tech 100 Index
US Tech 100 Index is heading towards the resistance line of a Ascending Triangle. If this movement continues, we expect the price of US Tech 100 Index to test 13843.5000 within the next 12 hours. But don’t be so quick to trade, it has tested this line numerous times in the past, so this movement […]
Should we expect a breakout or a rebound on US SPX 500 Index?
The movement of US SPX 500 Index towards the resistance line of a Channel Up is yet another test of the line it reached numerous times in the past. We expect this line test to happen in the next 2 days, but it is uncertain whether it will result in a breakout through this line, […]

Either a rebound or a breakout imminent on US Tech 100 Index
US Tech 100 Index is heading towards the resistance line of a Channel Up. If this movement continues, we expect the price of US Tech 100 Index to test 13837.2000 within the next 2 days. But don’t be so quick to trade, it has tested this line numerous times in the past, so this movement […]